
20230418.6
Date |
|
|---|---|
Focus | More data and enhanced UX |
What’s New!
Verdict Context
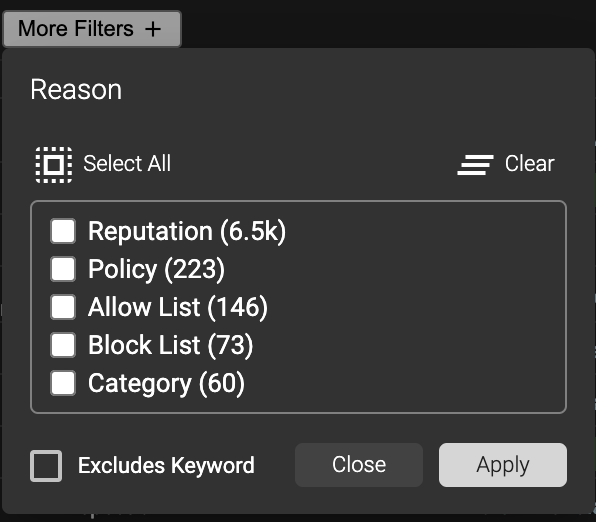
A new column, labeled “Reason” has been added into the Logs view
The “Reason” column can be one of five (5) values: (Category, Allow List, Block List, Policy, or Reputation)
Category - A specific Category has triggered a “Blocked” Status
Allow List - An artifact (FQDN, Domain, IP Address, CIDR, Nameserver, or Registrar) is on an Allow List and thus “Permitted” Status
Block List - An artifact (FQDN, Domain, IP Address, CIDR, Nameserver, or Registrar) is on a Block List and thus “Blocked” Status
Policy - A Policy has been triggered as Allow or Block via a Rule that matches Type (24), Condition, and Value and thus “Permitted” or “Blocked” Status
Reputation - Determined via our propriety calculation which may be “Permitted”, “Blocked”, “Highly Suspicious”, “Watch Engine” or “No Status”
When traffic of the above Reason exists in your Logs view, then each can be filtered appropriately through the new “Reason” filter available from the “More Filters +” button:
Deployment Mode column
An additional column, “Deployment Mode” has been added to distinguish the mode in which HYAS Protect was operating in, at the Date of trigger
The Deployment Mode can be one of three values: (Protection, Inspection, and Passthrough)
The Deployment Mode can be toggled by an Admin through the “Global Settings” between Protection and Inspection
Improvements!
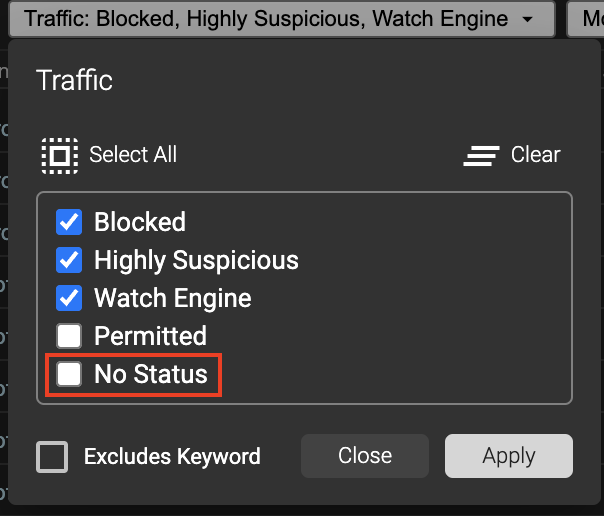
Additional Traffic option: “No Status”
Previously, the Traffic options were limited to: (Blocked, Highly Suspicious, Watch Engine, and Permitted). In this version the explicit “No Status” option has been added. Although the same result was previously accessible by selecting the four (4) options and selecting the “Excludes Keyword”, now that extra step is no longer needed, as “No Status” has been promoted to an explicit option that can be selected.

Additional Aggregations: Category, Client IP, and Tag
Three (3) new options have been introduced when utilizing the “Aggregate Logs” toggle to include Category, Client IP, Tag
The “Aggregate Logs” capability enables the ability to hone in on up to eight (8) distinct artifacts, where the previously existing five (5) are: Country, Device Name, Domain, FQDN, and Status