Protect DNS Logs
Overview
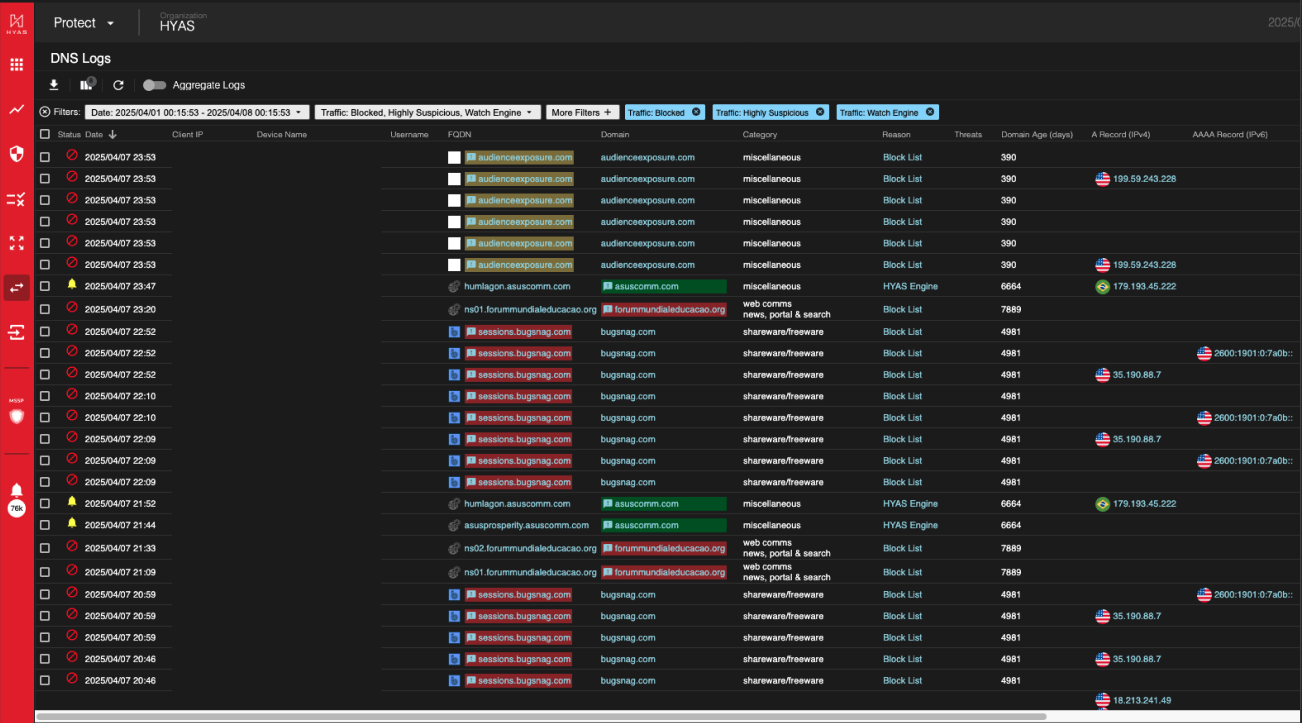
The HYAS Protect Logs view offers a comprehensive presentation of your organization's DNS traffic log data. Upon your first visit, you'll encounter deviations from usual patterns in the displayed traffic. You can then explore all logs, utilizing advanced filtering to narrow or expand your search parameters. This default view showcases three types of traffic categorized as Blocked, Highly Suspicious, or flagged by the Watch Engine. The two additional traffic types, "Permitted," and “No Status” are not initially shown but can be accessed. Let’s take a deeper look into HYAS Protect’s Logs View.
Export Results
The “Export Results” icon, as denoted by the arrow pointing downward with a horizontal line, will download the logs shown that have been checked off into either JSON or CSV format. The current behavior is such that:
CSV will download the records selected in the sequence (columns and order) shown in the UI.
JSON will download an entire dump of the records selected and ignores the column selected via the UI.
Customize View
Adjacent to the Export Results icon is the Customize Table icon. This enables you to tailor the columns and their display order in your DNS logs. However, note that the first three (3) columns—Status, Date, and Client IP—are fixed in their positions and cannot be reconfigured.
Refresh
Use this button to refresh the log entries with real time traffic.
Aggregate Logs View
Aggregating logs allows a user to view DNS traffic by Country, Device Name, Domain, FQDN, or Status, allowing focused analysis within a seven-day window from the past ninety days, with additional layers of aggregation and simple filters available, and special empty values for certain categories. Click here to learn more about Aggregate Logs View.
Infinite Scrolling
Toggling Infinite Scrolling to the on position will allow you to avoid paging through logs. Data will be automatically loaded as you scroll through the logs.
Filters
HYAS Protect allows for a large array of filtering options. Let’s have a closer look at what they are.
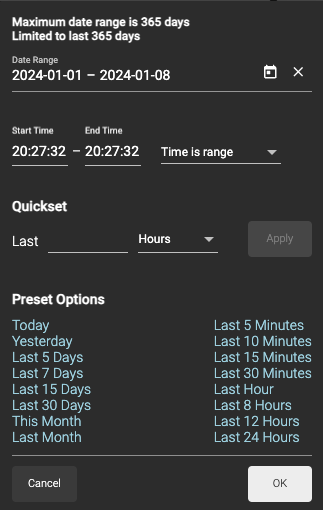
Date Picker
The Date Picker allows you to customize the date/time frame for the logs you wish to view. You may select from the predefined filters at the bottom or select your own range down to the second for the past 365 days.
Traffic Type
In the Traffic drop down box, you may select for viewing Blocked, Highly Suspicious, Watch Engine, Permitted, and/or No Status traffic.
Blocked
In Protection Mode, users are restricted from accessing blocked domains. These blocks can occur dynamically through the Decision Engine, the block list, category-based blocks, or the Policy Engine.
Highly Suspicious
Highly Suspicious traffic is one tier below blocked traffic on the weighted risk score. HYAS Protect will take these domains, containerize them and run further analytics against them to determine safety.
Highly Suspicious traffic IS NOT BLOCKED however, has been assigned an elevated risk score just under the blocking threshold. These domains may want to be investigated further.
Watch Engine
Watch Engine traffic is one tier below Highly Suspicious traffic on the weighted risk score. HYAS Protect will take these domains, containerize them and run further analytics against them to determine safety.
This traffic is not blocked however may be deserving of some additional attention.
Permitted
Permitted traffic has undergone analysis by the Decision Engine and is deemed safe to communicate with.
No Status
No Status means the DNS query has insufficient indicators to render a verdict. This generally means there is not enough information about the infrastructure related to the domain to make an educated decision on whether the domain is safe or malicious.
Additional Filters
HYAS Protect offers users the ability to filter on 24 different types of domain based artifacts for each query. The table below details which pieces of information you can filter on. Click on the artifact for a definition.
Type | Date Type | Value |
|---|---|---|
IPv4 Address | Keyword | |
IPv6 Address | Keyword | |
Name | Keyword | |
IPv4 Address | Keyword | |
Name | Keyword | |
Fully Qualified Domain Name | Keyword | |
Top Level Domain | Keyword | |
Name | Keyword | |
Name | Multi-select | |
Name | Keyword | |
Domain | Keyword | |
Number | Numeral Range | |
Name | Multi-select | |
Top Level Domain | Keyword | |
Name | Multi-select | |
Fully Qualified Domain Name | Keyword | |
Fully Qualified Domain Name | Keyword | |
Name | Keyword | |
Domain | Keyword | |
Name | Keyword | |
IPv4 Address | Keyword | |
Top Level Domain | Keyword | |
Name | Keyword | |
Name | Keyword | |
Name | Multi-select | |
Name | Keyword | |
Name | Keyword | |
Name | Multi-select | |
Name | Keyword | |
Name | Multi-select | |
Name | Keyword | |
Name | Multi-select | |
Number | Numeral Range | |
Name | Keyword |
Right-Click on Artifacts
When you right-click on artifacts in Log View, you'll see additional options for the selected artifact. All artifacts, except blank ones and those in the Status column, support right-clicking to reveal two or more of the options listed below.
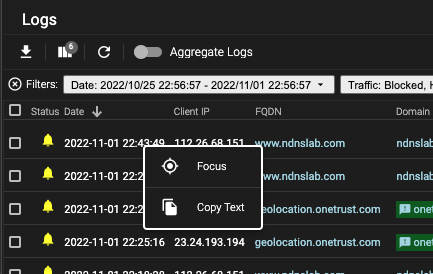
Focus
When selected, the right-clicked artifact will apply a filter that displays all the logs that match the filter.
Applies to: All artifacts that can be right-clicked
Exclude
Inverse of focus, when selected, the right-clicked artifact will apply a filter that excludes logs that match the filter.
Applies to: All artifacts that can be right-clicked, except Date
Block List
Add to the Default Blocklist for the specific artifact type (FQDNs, Domains, IP Addresses, CIDRs, Nameservers, and Registrars)
To view/edit this action, browse to the “List Management” icon on the left side of the screen, “Blocklist” should be toggled on by default, and then browse to the tab of the artifact type that has been blocked.
Applies to: Client IP, FQDN, Domain, FQDN Nameserver, ARecord IP, and Registrar
Allow List
Add to the Default Allowlist for the specific artifact type (FQDNs, Domains, IP Addresses, CIDRs, Nameservers, and Registrars)
Applies to: Client IP, FQDN, Domain, FQDN Nameserver, ARecord IP, and Registrar
Search
This option will open a Google search page pertaining to the artifact you right-clicked.
Applies to: FQDN, Domain
HYAS Insight
Selecting HYAS Insight from the right-click menu will navigate the user to Insight, if they have an account, for further investigation. HYAS Insight is an advanced threat intelligence and investigation platform that gives organizations the ability to identify, track, and attribute fraud and attacks faster and more efficiently. If you do not have an account and would like further information, please reach out to HYAS Support.
Applies to: Client IP, FQDN, Domain, ARecord IP, AAAARecord IP, Registrar, FQDN Nameserver, Nameserver, NS IP
Copy Text
Copies the selected artifact to your local clipboard.
Applies to: All artifacts that can be right-clicked
Information panel
For additional information on an artifact, just click on the domain, and a fly-out panel will open on the right, providing useful information and options. Below, you'll find details on the various options available in the Informational Panel.
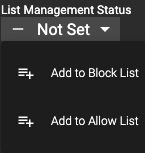
List Management Status
Here is where you can see whether a domain is part of a block/allow list. A list management Status of “Not Set” means the domain is not part of a block/allow list. However, this doesn’t mean that the domain will not be blocked if deemed malicious. The Decision Engine will make that determination in absence of list or policy configuration.
You’re also able to add a domain to a block/allow list from the dropdown. Conversely, if the domain is part of a block/allow list and you’d like to adjust that status, you may do here as well.
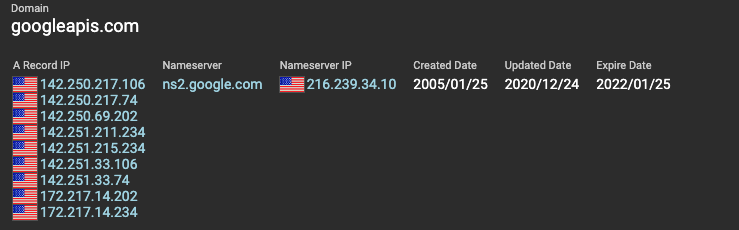
Domain Information
Next on the Information Panel is domain information. Here you can view the A-record, nameserver, nameserver IP, created date, updated date and expire date.
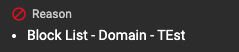
Reason / Verdict Information
The Reason section gives you additional context into how a verdict in HYAS Protect was reached.
This example domain was blocked because is was part of the Block List based on Domain named TEst
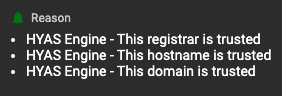
On the other hand, this domain was allowed because of 3 main factors as determined by the HYAS Decision Engine: The registrar, hostname and domain were all trusted.
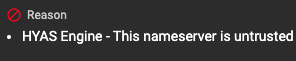
In our last example, we can see that the Decision Engine made the call to block this domain because, among other reasons, the nameserver is untrusted.
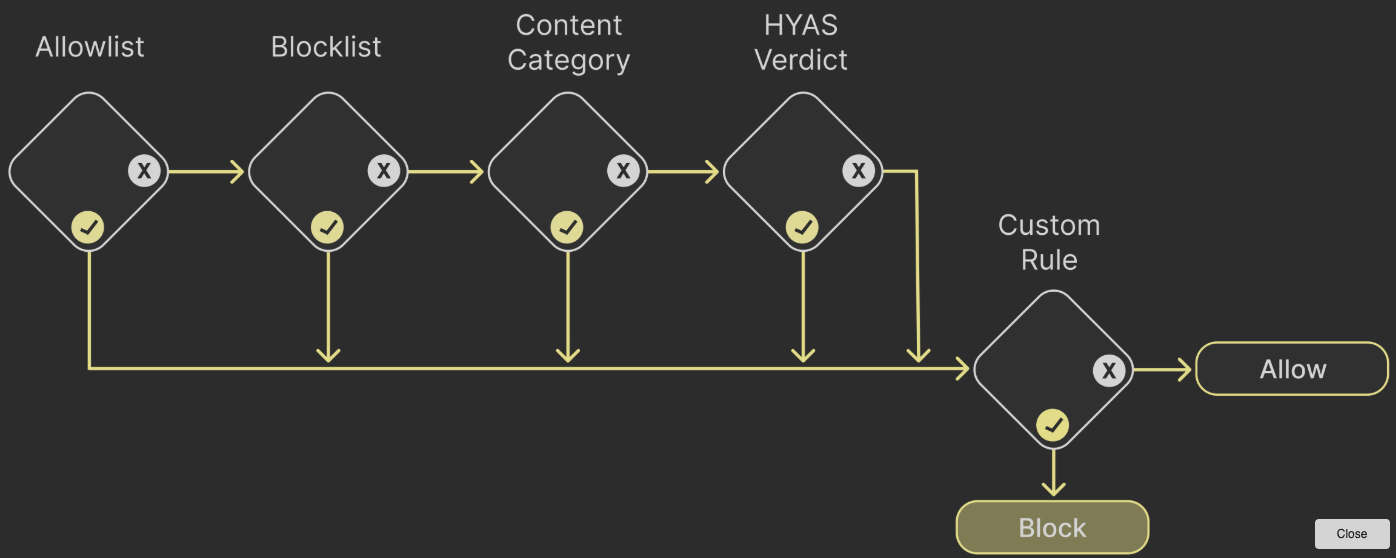
Reason Flowchart
The Reason Flowchart details the steps taken in the HYAS Protect process of Allowlists, Blocklists, Categories, HYAS Decision Engine and Rulesets. You may access the flow chart by clicking on the View Reason Flowchart link in the Information Panel.
Here is the Reason Flowchart
Tags / Notes
HYAS Protect allows you to add Tags and Notes related to domains. Tags are generally a few words and Notes are usually longer text strings. Use these to leave information around why domains were manually added to a block/allow list or any other data that may be useful for you and your team.
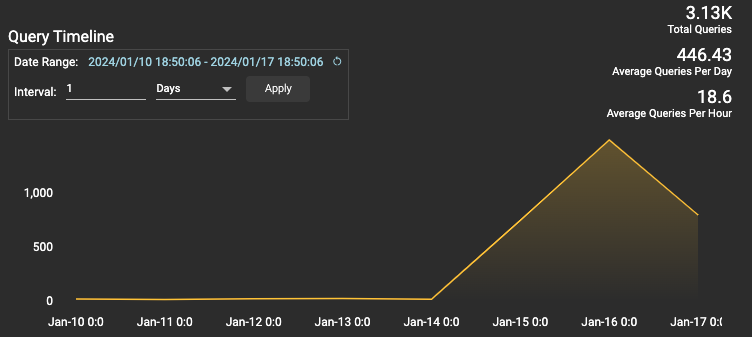
Query Timeline
This section has a visual representation of the query pattern for an artifact. You can select the time/date range as well as toggle between hourly and daily views. You will also see the Total Queries, Average Queries Per Day and Average Queries Per Hour.
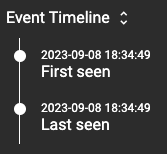
Event Timeline
Event timeline show you when a domain was First and Last seen.