Protect Overview Page
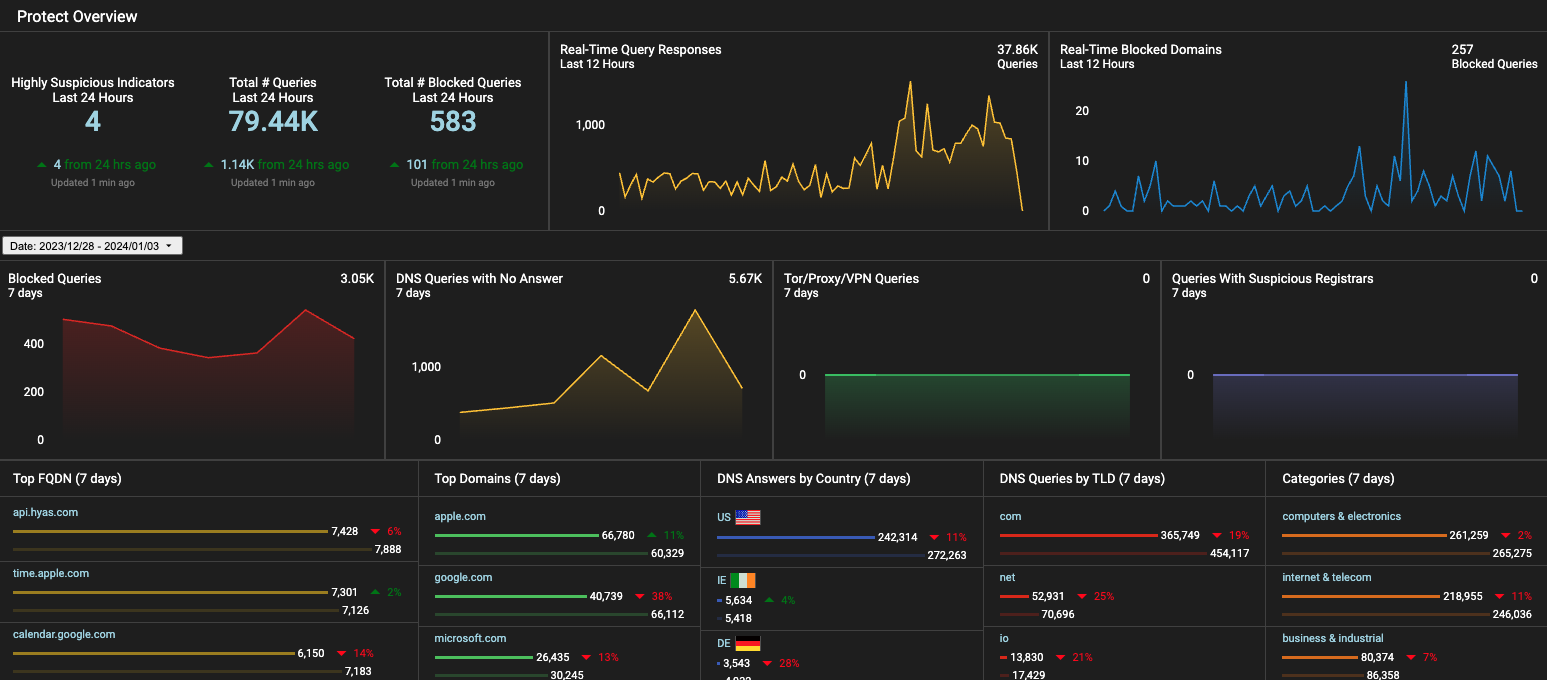
The Protect Overview Page in HYAS Protect provides an aggregated summary of your DNS traffic activity. It offers a comprehensive, bird’s-eye view of DNS queries, helping you easily monitor overall traffic patterns and detect security events.
Tiles
Highly Suspicious Indicators
A real-time look at the number of malicious indicators HYAS Protect has flagged within your organization’s network traffic as “Highly Suspicious”.
Real-Time Query Responses
A real-time look at the volume of network traffic for the organization in the last 24 hours.
Real-Time Blocked Domains
A real-time look at the number of queries that are actively being blocked in the last 24 hours.
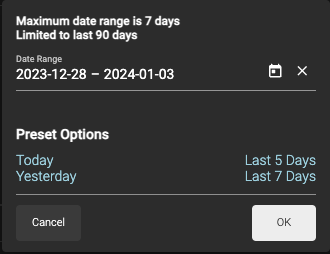
Date Picker
Use the date picker (located between the upper and lower graphs) to modify the scope of the data displayed on the Overview page.
Maximum date range 7 days
Limited to last 90 days
Today, Yesterday, Last 5 Days, and Last 7 Days as Presets.
By default, the date range is last 7 days
The Date Picker applies to the tiles underneath it; the first row is comprised of tiles fixed on 24/12/12 hours, respective
Blocked Queries
These are queries to known malicious domains. They may be related to phishing, scamming, botnets, malware downloads, or malware command and control structures. These queries were all successfully blocked by HYAS Protect, but may not have been reported as an alert or security event.
DNS Queries with No Answer
It is not uncommon for DNS queries to have no answers. Most common is a user mistyping a domain, or a sysadmin misconfiguring an automated system.
NXDOMAIN queries can also be symptomatic of a security event. Spikes in NXD queries should be responded to quickly and investigated thoroughly.
Tor/Proxy/VPN Queries
Domains were tagged because it points to an IP that we have verified to be related to onion routing (aka dark web).
Queries With Suspicious Registrars
Domains were tagged because the registrar handling this domain also has a number of other known malicious/risky domains on it, or has other characteristics that implicate this registrar (and the domains on it) as risky.
Top FQDN
These are the most frequently visited "Fully Qualified Domain Names" for the last “X” days (7 default). Review this information frequently for spikes and changes in traffic as this could be an early indicator of new, high-risk behavior from within the organization.
Top Domains
These are the most frequently visited root domains for the last “X” days (7 default). Review this information frequently for spikes and changes in traffic as this could be an early indicator of new high risk behavior from within the organization.
DNS Answers by Country
These are the countries that domains and IPs have resolved to for the last “X” days (7 default). Some geographies tend to have much higher rates of cyber crime. Review this data frequently and watch for spikes towards suspect countries.
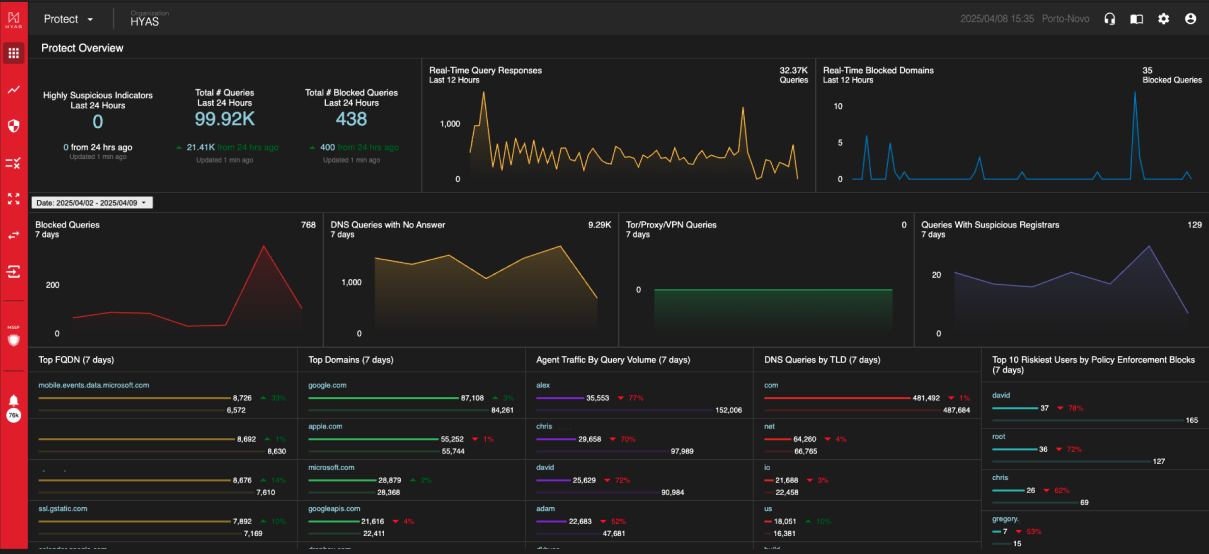
When the Protect Agent is deployed, this chart is replaced by Agent Traffic By Query Volume (7 Days)
Agent Traffic BY Query Volume (7 days)
When the Protect Agent is deployed, this chart displays the top 25 Agents (by Username) in query volume for the last 7 days.
DNS Queries by TLD
HYAS Protect applies different reputation weights towards various top level domains. Monitor this data frequently for spikes in suspicious TLDs (.ru, .xyz, and so forth).
When utilizing deployment methods that include the Protect Agent, SentinelOne or Microsoft Defender for Endpoint, this chart is replaced with the Top 10 Riskiest Users by Blocked Security Events (7 days)
Top 10 Riskiest Users by Blocked Security Events (7 days)
When an organization has deployed HYAS Protect using the Protect Agent, SentinelOne or Microsoft Defender for Endpoint, this chart displays the top 10 riskiest suers by blocked security events. Security Events are defined as blocks made by the HYAS Protect decision service, not by user generated policies.
Categories
Here, you can see the top destinations travelled to based on their category. i.e. science, computers & electronics, gambling etc.
When utilizing deployment methods that include the Protect Agent, SentinelOne or Microsoft Defender for Endpoint, this chart is replaced with the Top 10 Riskiest Users by Policy Enforcement (7 days)
Top 10 Riskiest Users by Policy Enforcement (7 days)
When an organization has deployed HYAS Protect using the Protect Agent, SentinelOne or Microsoft Defender for Endpoint, this chart displays the top 10 riskiest suers by policy enforcement. Policy Enforcement events are defined as blocks made by user generated policies.
Pivoting on Tiles
All text in Blue can be interacted with. Clicking on the blue text will take you to a filtered log view for the data you just pivoted off of.
Line graphs can be clicked on as well. Just select the data point you wish to pivot off of and you’ll be taken to a filter log view showing that data.