Protect Executive Dashboard
The Executive Dashboard in HYAS Protect provides a high-level overview tailored for executives, showcasing how HYAS Protect enhances security and delivers value. It highlights key metrics and insights, offering a clear picture of the platform’s impact on keeping clients safer.
Charts and Graphs within the Protect Executive Dashboard
To drill down for additional insights from any chart (except Traffic Volume by Source Type), hover over the desired data point and click to access a filtered log view.
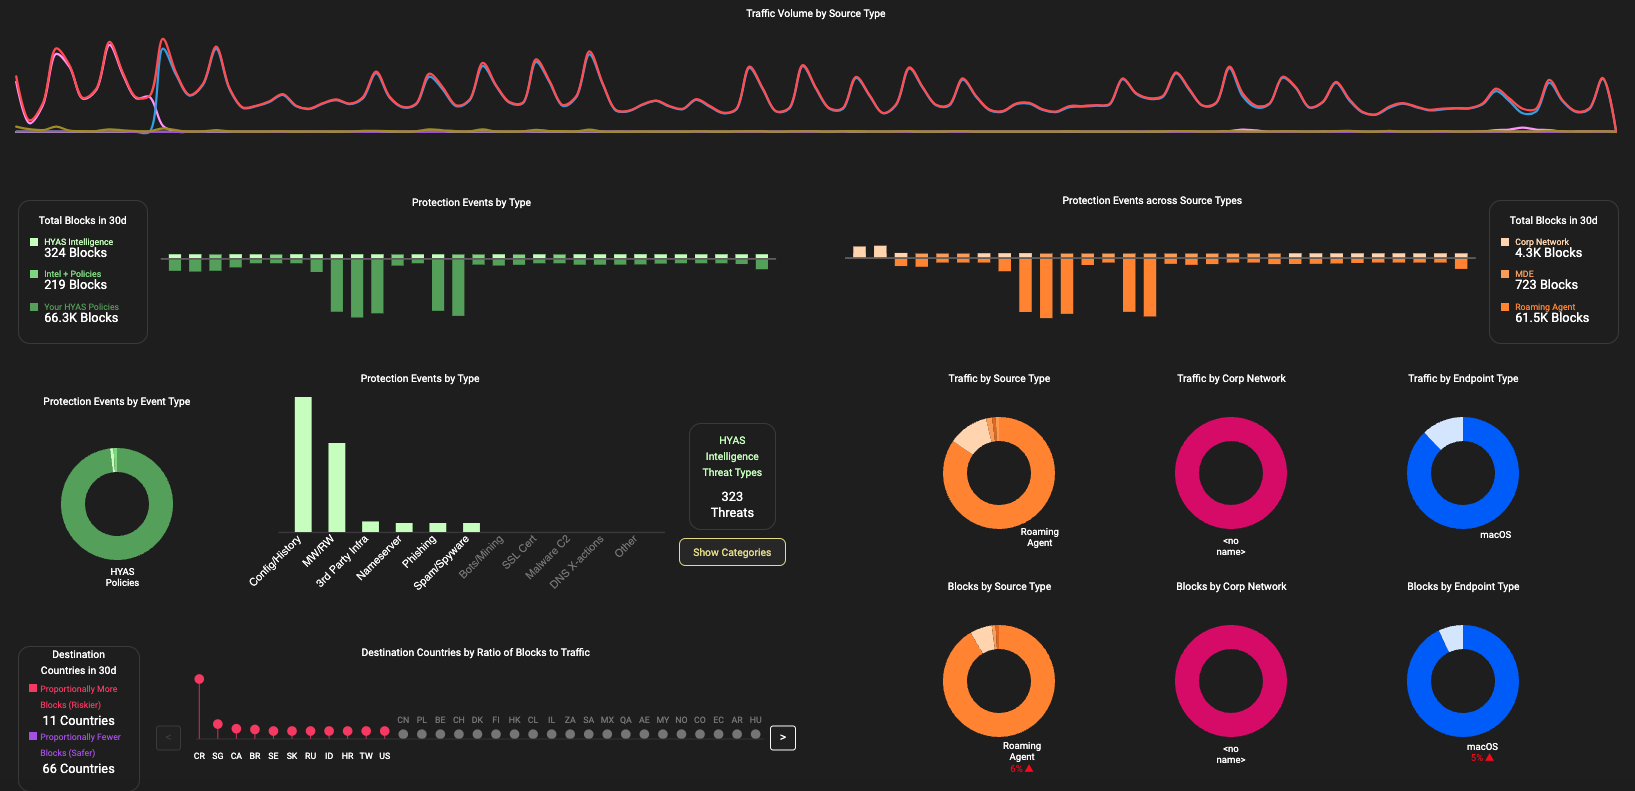
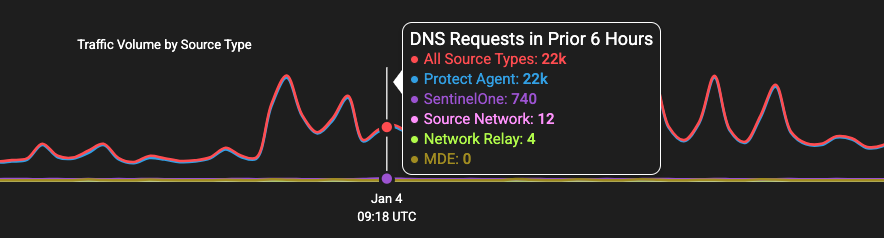
Traffic by Source Type
Source Type refers to the origin of ingested traffic, which can come from sources such as Protect Agent, MDE, SentinelOne, and Source Network. The line graph shows the volume of DNS traffic over the past 30 days. By hovering over any point on the graph, you can view a detailed breakdown of where the traffic originated during the preceding six hours.
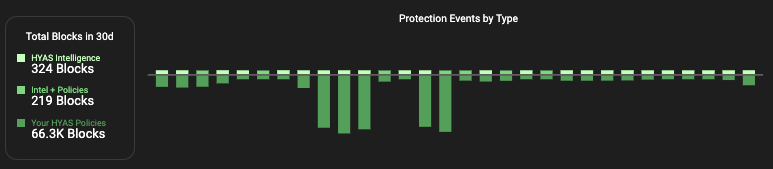
Protection Events by Type - Bar Chart by Day
The bar chart shows the total number of blocks by three different types:
HYAS Intelligence: These blocks are automatically enforced based on HYAS intelligence, including dynamic analysis from the HYAS Protect Decision Engine and domains flagged for Malicious Cyber Activity. They represent the built-in protections provided by HYAS Protect that require no additional configuration.
Intel + Policies: These blocks represent queries that were blocked by your custom policies but would have also been blocked by HYAS Intelligence.
Your HYAS Policies: Finally, these blocks are those triggered by the Policies you’ve created within HYAS Protect. This includes Categories, Rulesets and Lists.
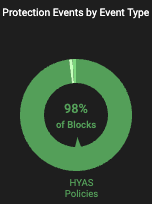
Protection Events by Type - Donut Chart
In line with the previously mentioned chart, the donut chart shows each type of block as a percentage of the total blocks.
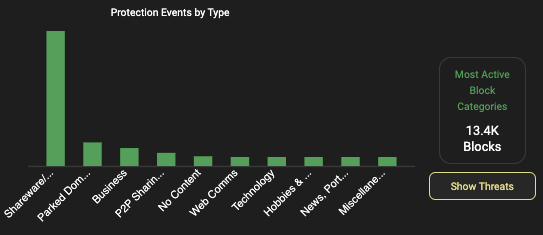
Protection Events by Type - Bar Chart by Intel and Categories
The final chart in the Protection Events by Type trio toggles between two data sets.
HYAS Intelligence Threat Types shows us the block reasons as determined by HYAS Intelligence including domain Config/History, Malware/Ransomware, dangerous 3rd Party Infrastructure and more.
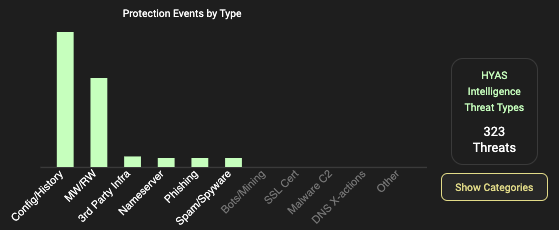
Clicking on the ‘Show Categories’ button switches the chart data to display the the top Blocks by Category
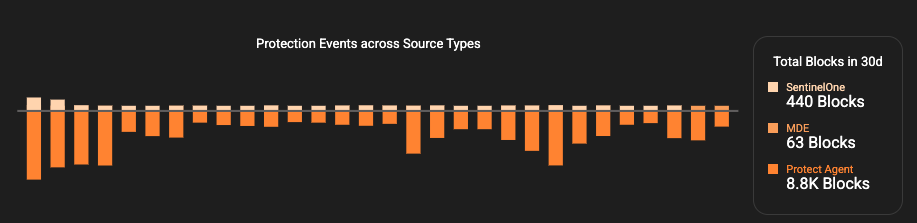
Protection Events across Source Types
This bar chart displays the number of blocks by Source Type, offering valuable insight into the origin of blocked threats. Understanding which sources contribute the most blocks can help identify high-risk areas, optimize security policies, and improve threat mitigation strategies.
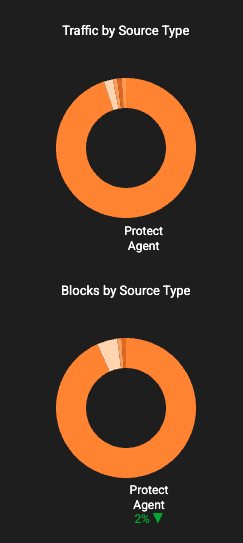
Traffic & Blocks by Source Type
Traffic by Source Type illustrates DNS traffic as a percentage of total traffic based on its source type.
Blocks by Source Type presents the percentage of total blocks categorized by source type.
While each chart provides valuable insights individually, analyzing them together helps identify trends in potentially risky source types, allowing for proactive mitigation of issues before they escalate.
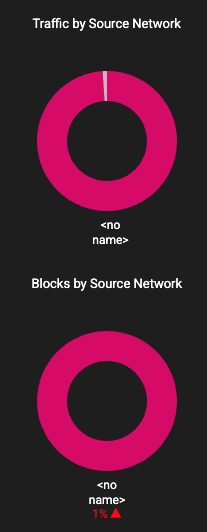
Traffic & Blocks by Source Network
Traffic by Source Network shows DNS traffic attributed to the Source network as a percentage of total traffic.
Blocks by Source Network indicates the percentage of total blocks that originate from the Source network.
Analyzing these charts separately provides important insights, but together they reveal patterns in Source network activity that could indicate potential risks, allowing for timely intervention before issues escalate.
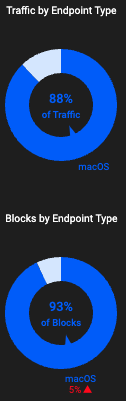
Traffic & Blocks by Endpoint Type
Traffic by Endpoint Type displays DNS traffic associated with various endpoint types as a percentage of the total traffic.
Blocks by Endpoint Type shows the percentage of total blocks that come from different endpoint types.
By examining both charts together, you gain a deeper understanding of endpoint activities, enabling you to spot irregularities or shifts in behavior more effectively. This holistic view empowers you to address potential vulnerabilities promptly, strengthening your overall security framework.
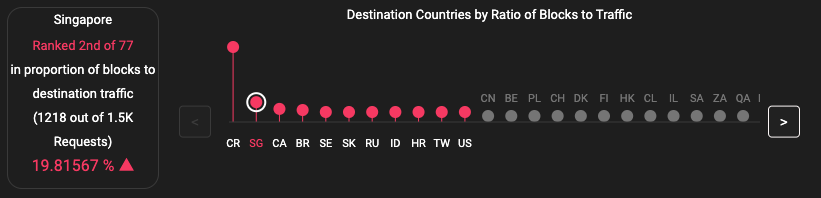
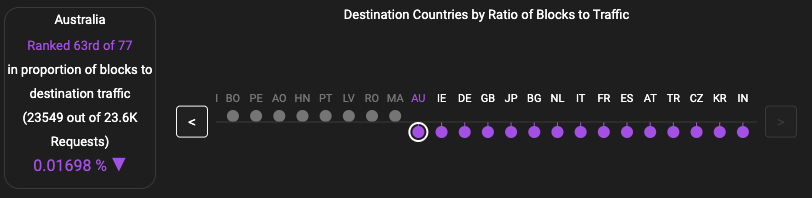
Destination Countries by Ratio of Blocks to Traffic
The “Destination Countries by Ratio of Blocks to Traffic” lollipop chart displays the percentage of blocks relative to total traffic for each country. A higher percentage indicates a greater relative risk when accessing domains in that country compared to others your traffic reaches.